Astronics Corporation • 130 Commerce Way • East Aurora, NY • 14052-2164
| | | | | |
| For more information, contact: | |
| |
| Company: | Investor Relations: |
| David C. Burney, Chief Financial Officer | Deborah K. Pawlowski, Kei Advisors LLC |
| Phone: (716) 805-1599, ext. 159 | Phone: (716) 843-3908 |
| Email: david.burney@astronics.com | Email: dpawlowski@keiadvisors.com |
FOR IMMEDIATE RELEASE
Astronics Corporation Reports
2022 Fourth Quarter and Full Year Financial Results
•Sales for the quarter were $158.2 million, up 36% over prior-year period; full year sales were $534.9 million, up 20% over prior year
•Fourth quarter bookings totaled $182.4 million, with book-to-bill ratio of 1.15; full year bookings totaled $690.6 million, up 19.6% over prior year resulting in book-to-bill ratio of 1.29
•Backlog increased 37.4% during 2022 to a record $571.4 million; Aerospace backlog reached a record $477.7 million
•Net loss for the quarter was $6.8 million and adjusted EBITDA was $4.3 million
•Maintaining revenue guidance of $640 million to $680 million for 2023
EAST AURORA, NY, March 2, 2023 – Astronics Corporation (Nasdaq: ATRO) (“Astronics” or the “Company”), a leading supplier of advanced technologies and products to the global aerospace, defense and other mission critical industries, today reported financial results for the three and twelve months ended December 31, 2022.
Peter J. Gundermann, Chairman, President and Chief Executive Officer, commented, “Sales of
$158 million were above our expected range and validates both the recovery we are seeing in our commercial aerospace market as well as the progress being made with our supply chain. Bookings of $182 million demonstrates continued strong demand for our products and further substantiates our expectations for another 20% increase in sales in 2023. Although challenges remain, our supply chain continues to improve, which is necessary for us to meet our goals for the year.”
He added, “Margins remained under pressure in the quarter because of inflation and supply chain workarounds. We are passing on increased costs where we can although it will take time to roll through sales. We are expecting improvement in pricing as well as reduction in certain input costs as we advance through 2023.”
Astronics Corporation Reports 2022 Fourth Quarter and Full Year Financial Results
March 2, 2023
Page 2
Fourth Quarter Results
| | | | | | | | | | | | | | | | | | | | | | | |
| Three Months Ended | | Year Ended |
| ($ in thousands) | December 31, 2022 | December 31, 2021 | % Change | | December 31, 2022 | December 31, 2021 | % Change |
| | | | | | | |
| Sales | $ | 158,153 | | $ | 116,052 | | 36.3 | % | | $ | 534,894 | | $ | 444,908 | | 20.2 | % |
| Loss from Operations | $ | (3,167) | | $ | (8,744) | | 63.8 | % | | $ | (30,044) | | $ | (28,674) | | (4.8) | % |
Operating Margin % | (2.0) | % | (7.5) | % | | | (5.6) | % | (6.4) | % | |
| Net Gain on Sale of Businesses | $ | — | | $ | 10,677 | | | | $ | 11,284 | | $ | 10,677 | | |
| Net (Loss) Income | $ | (6,779) | | $ | 1,604 | | (522.6) | % | | $ | (35,747) | | $ | (25,578) | | (39.8) | % |
| Net (Loss) Income % | (4.3) | % | 1.4 | % | | | (6.7) | % | (5.7) | % | |
| | | | | | | |
| *Adjusted EBITDA | $ | 4,305 | | $ | (805) | | 634.8 | % | | $ | 4,372 | | $ | 1,898 | | 130.3 | % |
*Adjusted EBITDA Margin % | 2.7 | % | (0.7) | % | | | 0.8 | % | 0.4 | % | |
*Adjusted EBITDA is a Non-GAAP Performance Measure. Please see the attached table for a reconciliation of Adjusted EBITDA to GAAP net income.
Fourth Quarter 2022 Results (compared with the prior-year period, unless noted otherwise)
Consolidated sales were up $42.1 million from the fourth quarter of 2021. Aerospace sales were up by $39.5 million, or 40.0%, while Test Systems sales increased $2.6 million.
Consolidated operating loss was $3.2 million, compared with operating loss of $8.7 million in the prior-year period. Reduced operating loss reflects higher sales volume, a $5.3 million decline in legal expenses, $2.9 million decline in 401k contribution expense and the benefit of a $1.5 million gain related to indemnification proceeds received during the quarter associated with a litigation settlement. This was offset by approximately $6 million to $7 million in material and labor inflation. The prior-year period operating loss benefited from a $7.5 million offset to cost of products sold from the Aviation Manufacturing Jobs Protection (“AMJP”) Program grant and a $5.0 million gain on the sale of a facility.
Consolidated net loss was $6.8 million, or $(0.21) per diluted share, compared with net income of
$1.6 million, or $0.05 per diluted share, in the prior year, which included a $10.7 million pre-tax gain from the sale of its semiconductor business.
Consolidated adjusted EBITDA increased to $4.3 million, or 2.7% of consolidated sales, compared with adjusted EBITDA loss of $0.8 million, or 0.7% of consolidated sales, in the prior-year period.
Bookings were $182.4 million in the quarter resulting in a book-to-bill ratio of 1.15:1. Backlog of
$571.4 million at quarter end was at record levels for the fifth consecutive quarter. Approximately
$451.4 million of backlog is expected to ship in 2023.
Aerospace Segment Review (refer to sales by market and segment data in accompanying tables)
Aerospace Fourth Quarter 2022 Results (compared with the prior-year period, unless noted otherwise)
Aerospace segment sales increased $39.5 million, or 40.0%, to $138.3 million. Commercial transport sales increased 76.0%, or $44.4 million, and drove the improvement. Sales to this market were
$102.8 million, or 65.0% of consolidated sales in the quarter, compared with $58.4 million, or 50.4% of consolidated sales in the fourth quarter of 2021. Improving domestic and regional airline travel that is driving higher fleet utilization and increased narrowbody production rates drove demand for Astronics’ products.
Astronics Corporation Reports 2022 Fourth Quarter and Full Year Financial Results
March 2, 2023
Page 3
Military Aircraft sales decreased $2.3 million, or 14.7%, to $13.2 million. The prior-year period benefited from incremental non-recurring engineering revenue associated with development programs and higher sales of avionics products.
General Aviation sales decreased $0.9 million, or 5.8%, to $14.6 million. Other revenue decreased
$1.7 million to $7.6 million driven by decreased contract manufacturing programs.
Aerospace segment operating profit improved to $5.2 million compared with operating loss of $2.3 million in the same period last year. The increase in operating profit was driven by higher volume primarily in the commercial transport market, $7.1 million reduction in legal expenses, approximately $2.5 million lower 401K costs and a $1.5 million gain related to indemnification proceeds received during the quarter related to a litigation settlement which was recorded as an offset to SG&A expense. These were partially offset by the effects of material and labor inflation. The prior-year period operating loss benefited from a
$7.5 million offset to cost of products sold from the Aviation Manufacturing Jobs Protection (“AMJP”) Program grant, and a $5.0 million gain on the sale of a facility.
Aerospace bookings in the fourth quarter of 2022 were $151.7 million for a book-to-bill ratio of 1.10:1. While bookings declined 8.5% sequentially, they improved 2.7% from the prior year’s comparator quarter continuing the elevated level of orders realized with the ongoing recovery of the commercial airline industry. Backlog for the Aerospace segment was a record $477.7 million at the end of the fourth quarter of 2022.
Test Systems Segment Review (refer to sales by market and segment data in accompanying tables)
Test Systems Fourth Quarter Results (compared with the prior-year period, unless noted otherwise)
Test Systems segment sales were $19.8 million, up $2.6 million compared with the prior-year period driven by higher defense revenue.
Test Systems segment operating loss was $4.0 million compared with operating loss of $1.8 million in the fourth quarter of 2021. The higher operating loss was primarily attributable to mix and underabsorption of fixed costs due to volume, $1.8 million in increased legal expenses related to an ongoing litigation claim, and investments in staffing in preparation for the expected contract award from the U.S. Army. As previously disclosed, Astronics Test Systems was selected as the down select winner for the development of its Radio Test Set referred to as TS-4549/T. The Test Systems segment has been investing in significant new development programs which are expected to result in more profitable business in the near future.
Bookings for the Test Systems segment in the quarter were $30.7 million, for a book-to-bill ratio of 1.55:1 for the quarter. Backlog was $93.7 million at the end of 2022 compared with backlog of $81.0 million at the end of 2021.
Liquidity and Financing
Cash on hand at the end of the quarter was $13.8 million and capital expenditures in the quarter were $3.4 million. Net debt was $150.2 million, compared with $133.2 million at the end of 2021.
On January 19, 2023, the Company announced it had completed a financing transaction totaling
$205 million, which refinanced its previous revolving credit facility that was scheduled to mature in November 2023. The new financing consists of a $90 million asset-based term loan and a $115 million asset-based revolving credit facility. The term loan has a scheduled maturity of January 19, 2027, an interest rate of SOFR plus 8.75% and is collateralized primarily by real estate, fixed assets and intellectual property. The revolving credit facility has a scheduled maturity of January 19, 2026, an interest rate of SOFR plus 2.25% to 2.75% and is collateralized primarily by inventory and accounts receivable.
Astronics Corporation Reports 2022 Fourth Quarter and Full Year Financial Results
March 2, 2023
Page 4
Amortization of the term loan principal will begin in April 2023 with a monthly amortization rate of 0.292% of the outstanding term loan principal balance for the period April 1, 2023 through June 1, 2023, increasing to 0.542% per month for the period July 1, 2023 through September 1, 2023 then increasing to 0.833% thereafter.
The new capitalization provided post-closing available liquidity of approximately $35 million, net of required minimum liquidity of $20 million through the date of delivery of the compliance certificate for the quarter ended March 31, 2024, which will then revert to $10 million thereafter. The Company was cash flow positive in the fourth quarter, and expects to remain so in 2023.
2023 Outlook
Mr. Gundermann commented, “We are maintaining our earlier revenue guidance of $640 million to
$680 million for 2023. The midpoint of this range would represent growth of 23% for the year, slightly higher than the 20% growth achieved in 2022. We are encouraged by our fourth quarter revenue performance, our record backlog, and continued strong demand which is now benefitting from a recovery in the widebody/long-haul market. The first quarter is expected to be our lightest with revenue in the range of $140 million to $150 million. We expect subsequent quarterly revenue to be in the range of $160 million to $185 million, increasing throughout the year.”
He concluded, “Our ability to meet forecast for 2023 will certainly depend on the cooperation of our supply chain, which we perceive is slowly improving. Challenges certainly remain, but our supply base is getting more predictable and the ratio of positive surprises relative to negative surprises is getting higher. We have plenty of backlog for 2023, and believe our supply chain is on track to support our expected revenue range.”
Planned capital expenditures for 2023 are expected to be in the range of $17 million to $20 million.
Fourth Quarter 2022 Webcast and Conference Call
The Company will host a teleconference today at 4:45 p.m. ET. During the teleconference, management will review the financial and operating results for the period and discuss Astronics’ corporate strategy and outlook. A question-and-answer session will follow.
The Astronics conference call can be accessed by calling (201) 493-6784. The listen-only audio webcast can be monitored at investors.astronics.com. To listen to the archived call, dial (412) 317-6671 and enter replay pin number 13736547. The telephonic replay will be available from 7:45 p.m. on the day of the call through Thursday, March 9, 2023. A transcript of the call will also be posted to the Company’s Web site once available.
About Astronics Corporation
Astronics Corporation (Nasdaq: ATRO) serves the world’s aerospace, defense, and other mission critical industries with proven, innovative technology solutions. Astronics works side-by-side with customers, integrating its array of power, connectivity, lighting, structures, interiors, and test technologies to solve complex challenges. For over 50 years, Astronics has delivered creative, customer-focused solutions with exceptional responsiveness. Today, global airframe manufacturers, airlines, military branches, completion centers, and Fortune 500 companies rely on the collaborative spirit and innovation of Astronics. The Company’s strategy is to increase its value by developing technologies and capabilities that provide innovative solutions to its targeted markets.
Safe Harbor Statement
This news release contains forward-looking statements as defined by the Securities Exchange Act of 1934. One can identify these forward-looking statements by the use of the words “expect,” “anticipate,” “plan,” “may,” “will,” “estimate” or other similar expressions and include all statements with regard to the
Astronics Corporation Reports 2022 Fourth Quarter and Full Year Financial Results
March 2, 2023
Page 5
impact of COVID-19 on the Company and its future, reaching any revenue or Adjusted EBITDA margin expectations, the recovery of the commercial aerospace widebody/long haul markets, the recovery of its supply chain, the timing of pricing and impact of inflation on margins, and the expectations of demand by customers and markets. Because such statements apply to future events, they are subject to risks and uncertainties that could cause actual results to differ materially from those contemplated by the statements. Important factors that could cause actual results to differ materially from what may be stated here include the continued global impact of COVID-19 and related governmental and other actions taken in response, trend in growth with passenger power and connectivity on airplanes, the state of the aerospace and defense industries, the market acceptance of newly developed products, internal production capabilities, the timing of orders received, the status of customer certification processes and delivery schedules, the demand for and market acceptance of new or existing aircraft which contain the Company’s products, the need for new and advanced test and simulation equipment, customer preferences and relationships, and other factors which are described in filings by Astronics with the Securities and Exchange Commission. The Company assumes no obligation to update forward-looking information in this news release whether to reflect changed assumptions, the occurrence of unanticipated events or changes in future operating results, financial conditions or prospects, or otherwise.
FINANCIAL TABLES FOLLOW
Astronics Corporation Reports 2022 Fourth Quarter and Full Year Financial Results
March 2, 2023
Page 6
| | | | | | | | | | | | | | | | | |
| ASTRONICS CORPORATION |
| CONSOLIDATED INCOME STATEMENT DATA |
| (Unaudited, $ in thousands except per share data) |
| | | |
| Three Months Ended | | Year Ended |
| 12/31/2022 | 12/31/2021 | | 12/31/2022 | 12/31/2021 |
| Sales | $ | 158,153 | | $ | 116,052 | | | $ | 534,894 | | $ | 444,908 | |
Cost of products sold 1 | 136,643 | | 97,588 | | | 463,354 | | 379,545 | |
| Gross profit | 21,510 | | 18,464 | | | 71,540 | | 65,363 | |
Gross margin | 13.6 | % | 15.9 | % | | 13.4 | % | 14.7 | % |
| | | | | |
Selling, general and administrative 2 | 24,677 | | 32,222 | | | 101,584 | | 99,051 | |
SG&A % of sales | 15.6 | % | 27.8 | % | | 19.0 | % | 22.3 | % |
| Net gain on sale of facility | — | | 5,014 | | | — | | 5,014 | |
| | | | | |
| Loss from operations | (3,167) | | (8,744) | | | (30,044) | | (28,674) | |
Operating margin | (2.0) | % | (7.5) | % | | (5.6) | % | (6.4) | % |
| | | | | |
Net gain on sale of business 3 | — | | 10,677 | | | 11,284 | | 10,677 | |
| Other expense, net of other income | 431 | | 532 | | | 1,611 | | 2,159 | |
| Interest expense, net | 3,610 | | 1,552 | | | 9,422 | | 6,804 | |
| Loss before tax | (7,208) | | (151) | | | (29,793) | | (26,960) | |
| Income tax (benefit) expense | (429) | | (1,755) | | | 5,954 | | (1,382) | |
| Net (loss) income | $ | (6,779) | | $ | 1,604 | | | $ | (35,747) | | $ | (25,578) | |
| Net (loss) income % of sales | (4.3) | % | 1.4 | % | | (6.7) | % | (5.7) | % |
| | | | | |
| | | | | |
| Basic (loss) earnings per share: | $ | (0.21) | | $ | 0.05 | | | $ | (1.11) | | $ | (0.82) | |
| Diluted (loss) earnings per share: | $ | (0.21) | | $ | 0.05 | | | $ | (1.11) | | $ | (0.82) | |
| | | | | |
Weighted average diluted shares outstanding (in thousands) | 32,401 | | 31,915 | | | 32,164 | | 31,061 | |
| | | | | |
| Capital expenditures | $ | 3,392 | | $ | 1,395 | | | $ | 7,675 | | $ | 6,034 | |
| Depreciation and amortization | $ | 6,872 | | $ | 7,055 | | | $ | 27,777 | | $ | 29,005 | |
______________________________________________________________________________________________________
1 In September 2021, the Company was awarded a grant of $14.7 million as part of the Aviation Manufacturing Jobs Protection Program. In the year ended December 31, 2022, $6.0 million was recognized as an offset to the cost of products sold. In the quarter and year ended December 31, 2021, $7.6 million and $8.7 million, respectively, was recognized as an offset to the cost of products sold.
2 Includes fair value adjustment of contingent consideration liabilities, which was a $2.2 million benefit in the year ended December 31, 2021. The quarter and year ended December 31, 2021 also includes $8.4 million reserve related to its ongoing patent litigation dispute. Additionally, the year ended December 31, 2022 reflects $4.6 million related to the settlement of a litigation claim, a customer accommodation dispute, and a lease termination settlement. In the fourth quarter of 2022, the Company was indemnified by other parties for approximately $1.5 million related to the settlement of the litigation claim and record the gain as an offset to SG&A in that period.
3 Net gain on sale of business for the year ended December 31, 2022 and the quarter and year ended December 31, 2021 is comprised of the additional gain on the sale of the Company’s former semiconductor test business resulting from the contingent earnout for the 2020 and 2021 calendar years.
Astronics Corporation Reports 2022 Fourth Quarter and Full Year Financial Results
March 2, 2023
Page 7
| | | | | | | | | | | | | | | | | |
| ASTRONICS CORPORATION |
| SEGMENT DATA |
| (Unaudited, $ in thousands) |
| | | | | |
| Three Months Ended | | Year Ended |
| 12/31/2022 | 12/31/2021 | | 12/31/2022 | 12/31/2021 |
| Sales | | | | | |
| Aerospace | $ | 138,335 | | $ | 98,836 | | | $ | 461,206 | | $ | 365,261 | |
| Less Inter-segment | — | | — | | | (10) | | (23) | |
| Total Aerospace | 138,335 | | 98,836 | | | 461,196 | | 365,238 | |
| | | | | |
| Test Systems | 19,818 | | 17,216 | | | 73,717 | | 80,027 | |
| Less Inter-segment | — | | — | | | (19) | | (357) | |
| Total Test Systems | 19,818 | | 17,216 | | | 73,698 | | 79,670 | |
| | | | | |
| Total consolidated sales | 158,153 | | 116,052 | | | 534,894 | | 444,908 | |
| | | | | |
| Segment operating profit (loss) and margins | | | | | |
| Aerospace | 5,202 | | (2,262) | | | (1,883) | | (8,614) | |
| 3.8 | % | (2.3) | % | | (0.4) | % | (2.4) | % |
| Test Systems | (3,993) | | (1,807) | | | (8,118) | | (3,765) | |
| (20.1) | % | (10.5) | % | | (11.0) | % | (4.7) | % |
| Total segment operating profit (loss) | 1,209 | | (4,069) | | | (10,001) | | (12,379) | |
| | | | | |
| | | | | |
| Net gain on sale of business | — | | 10,677 | | | 11,284 | | 10,677 | |
| Interest expense | 3,610 | | 1,552 | | | 9,422 | | 6,804 | |
Corporate expenses and other 1 | 4,807 | | 5,207 | | | 21,654 | | 18,454 | |
| Loss before taxes | $ | (7,208) | | $ | (151) | | | $ | (29,793) | | $ | (26,960) | |
______________________________________________________________________________________________________
1 Includes fair value adjustment of contingent consideration liabilities, which was a $2.2 million benefit in the year ended December 31, 2021.
Astronics Corporation Reports 2022 Fourth Quarter and Full Year Financial Results
March 2, 2023
Page 8
Reconciliation to Non-GAAP Performance Measures
In addition to reporting net income, a U.S. generally accepted accounting principle (“GAAP”) measure, we present Adjusted EBITDA (earnings before interest, income taxes, depreciation and amortization, non-cash equity-based compensation expense, goodwill, intangible and long-lived asset impairment charges, equity investment income or loss, legal reserves, settlements and recoveries, restructuring charges, gains or losses associated with the sale of businesses and grant benefits recorded related to the AMJP program), which is a non-GAAP measure. The Company’s management believes Adjusted EBITDA is an important measure of operating performance because it allows management, investors and others to evaluate and compare the performance of its core operations from period to period by removing the impact of the capital structure (interest), tangible and intangible asset base (depreciation and amortization), taxes, equity-based compensation expense, goodwill, intangible and long-lived asset impairment charges, equity investment income or loss, legal reserves, settlements and recoveries, customer accommodation settlements, lease termination settlements, restructuring charges, fair value adjustments to the valuation of contingent consideration liabilities, gains or losses associated with the sale of businesses and grant benefits recorded related to the AMJP program, which is not commensurate with the core activities of the reporting period in which it is included. As such, the Company uses Adjusted EBITDA as a measure of performance when evaluating its business and as a basis for planning and forecasting. Adjusted EBITDA is not a measure of financial performance under GAAP and is not calculated through the application of GAAP. As such, it should not be considered as a substitute for the GAAP measure of net income and, therefore, should not be used in isolation of, but in conjunction with, the GAAP measure. Adjusted EBITDA, as presented, may produce results that vary from the GAAP measure and may not be comparable to a similarly defined non-GAAP measure used by other companies.
| | | | | | | | | | | | | | | | | | | | | | | |
ASTRONICS CORPORATION |
| RECONCILIATION OF NET (LOSS) INCOME TO ADJUSTED EBITDA |
| (Unaudited, $ in thousands) |
| | | | | | | |
| Consolidated |
| Three Months Ended | | Year Ended |
| 12/31/2022 | | 12/31/2021 | | 12/31/2022 | | 12/31/2021 |
| Net (loss) income | $ | (6,779) | | | $ | 1,604 | | | $ | (35,747) | | | $ | (25,578) | |
| Add back (deduct): | | | | | | | |
| Interest expense | 3,610 | | | 1,552 | | | 9,422 | | | 6,804 | |
| Income tax (benefit) expense | (429) | | | (1,755) | | | 5,954 | | | (1,382) | |
| Depreciation and amortization expense | 6,872 | | | 7,055 | | | 27,777 | | | 29,005 | |
| Equity-based compensation expense | 1,319 | | | 1,313 | | | 6,497 | | | 6,460 | |
| | | | | | | |
| Contingent consideration liability fair value adjustment | — | | | — | | | — | | | (2,200) | |
| Restructuring-related charges including severance | — | | | 85 | | | 199 | | | 577 | |
| Legal reserve, settlements and recoveries | (1,500) | | | 8,374 | | | 500 | | | 8,374 | |
| Customer accommodation settlement | — | | | — | | | 2,100 | | | — | |
| Lease termination settlement | — | | | — | | | 450 | | | — | |
| | | | | | | |
| Non-cash 401K contribution accrual | 1,212 | | | 4,199 | | | 4,512 | | | 4,199 | |
| AMJP grant benefit | — | | | (7,541) | | | (6,008) | | | (8,670) | |
| Net gain on sale of facility | — | | | (5,014) | | | — | | | (5,014) | |
| Net gain on sale of business | — | | | (10,677) | | | (11,284) | | | (10,677) | |
| Adjusted EBITDA | $ | 4,305 | | | $ | (805) | | | $ | 4,372 | | | $ | 1,898 | |
| | | | | | | |
| Sales | $ | 158,153 | | | $ | 116,052 | | | $ | 534,894 | | | $ | 444,908 | |
| Adjusted EBITDA margin | 2.7 | % | | (0.7) | % | | 0.8 | % | | 0.4 | % |
| | | | | | | |
Astronics Corporation Reports 2022 Fourth Quarter and Full Year Financial Results
March 2, 2023
Page 9
| | | | | | | | | | | |
| ASTRONICS CORPORATION |
| CONSOLIDATED BALANCE SHEET DATA |
| ($ in thousands) |
| (unaudited) | | |
| 12/31/2022 | | 12/31/2021 |
| ASSETS | | | |
| Cash and cash equivalents | $ | 13,778 | | | $ | 29,757 | |
| Accounts receivable and uncompleted contracts | 147,790 | | | 107,439 | |
| Inventories | 187,983 | | | 157,576 | |
| Other current assets | 15,743 | | | 45,089 | |
| | | |
| Property, plant and equipment, net | 90,658 | | | 95,236 | |
| Other long-term assets | 21,633 | | | 21,439 | |
| Intangible assets, net | 79,277 | | | 94,320 | |
| Goodwill | 58,169 | | | 58,282 | |
| Total assets | $ | 615,031 | | | $ | 609,138 | |
| | | |
| LIABILITIES AND SHAREHOLDERS' EQUITY | | | |
| Current maturities of long-term debt | $ | 4,500 | | | $ | — | |
| Accounts payable and accrued expenses | 114,545 | | | 91,257 | |
| Customer advances and deferred revenue | 32,567 | | | 27,356 | |
| | | |
| Long-term debt | 159,500 | | | 163,000 | |
| Other liabilities | 63,999 | | | 70,921 | |
| Shareholders' equity | 239,920 | | | 256,604 | |
| Total liabilities and shareholders' equity | $ | 615,031 | | | $ | 609,138 | |
Astronics Corporation Reports 2022 Fourth Quarter and Full Year Financial Results
March 2, 2023
Page 10
| | | | | | | | | | | |
| ASTRONICS CORPORATION |
| CONSOLIDATED CASH FLOWS DATA |
| (Unaudited, $ in thousands) | Year Ended |
| Cash flows from operating activities: | December 31, 2022 | | December 31, 2021 |
| | | |
| Net loss | $ | (35,747) | | | $ | (25,578) | |
| Adjustments to reconcile net loss to cash flows from operating activities: | | | |
| Non-cash items: | | | |
| Depreciation and amortization | 27,777 | | | 29,005 | |
| Provisions for non-cash losses on inventory and receivables | 3,415 | | | 3,942 | |
| Equity-based compensation expense | 6,497 | | | 6,460 | |
| Deferred tax expense (benefit) | 19 | | | (441) | |
| | | |
| Net gain on sale of business | (11,284) | | | (10,677) | |
| Net gain on sales of assets | — | | | (5,083) | |
| Contingent consideration liability fair value adjustment | — | | | (2,200) | |
| Operating lease non-cash expense | 6,028 | | | 5,198 | |
| Non-cash 401K contribution accrual | 4,512 | | | 4,199 | |
| Non-cash litigation provision | 500 | | | 8,374 | |
| Restructuring activities | — | | | 267 | |
| | | |
| | | |
| Other | 3,086 | | | 3,912 | |
| Cash flows from changes in operating assets and liabilities: | | | |
| Accounts receivable | (41,646) | | | (14,832) | |
| Inventories | (34,058) | | | (5,150) | |
| Prepaid expenses and other current assets | 261 | | | 20 | |
| Accounts payable | 27,843 | | | 8,610 | |
| Accrued expenses | 787 | | | (5,037) | |
| Income taxes payable/receivable | 16,134 | | | 156 | |
| Operating lease liabilities | (7,295) | | | (6,036) | |
| Customer advanced payments and deferred revenue | 5,264 | | | (235) | |
| Supplemental retirement plan and other liabilities | (405) | | | (404) | |
| Cash flows from operating activities | (28,312) | | | (5,530) | |
| Cash flows from investing activities: | | | |
| | | |
| Proceeds from sales of businesses and assets | 22,061 | | | 9,213 | |
| Capital expenditures | (7,675) | | | (6,034) | |
| | | |
| Cash flows from investing activities | 14,386 | | | 3,179 | |
| Cash flows from financing activities: | | | |
| Proceeds from long-term debt | 125,825 | | | 20,000 | |
| Principal payments on long-term debt | (124,825) | | | (30,000) | |
| | | |
| | | |
| Stock award and employee stock purchase plan activity | 97 | | | 3,396 | |
| Finance lease principal payments | (93) | | | (901) | |
| Financing-related costs | (2,416) | | | — | |
| Cash flows from financing activities | (1,412) | | | (7,505) | |
| Effect of exchange rates on cash | (641) | | | (799) | |
| Decrease in cash and cash equivalents | (15,979) | | | (10,655) | |
| Cash and cash equivalents at beginning of year | 29,757 | | | 40,412 | |
| Cash and cash equivalents at end of year | $ | 13,778 | | | $ | 29,757 | |
| | | |
| | | |
| | | |
Astronics Corporation Reports 2022 Fourth Quarter and Full Year Financial Results
March 2, 2023
Page 11
| | | | | | | | | | | | | | | | | | | | | | | | | | |
| ASTRONICS CORPORATION |
| SALES BY MARKET |
| (Unaudited, $ in thousands) |
| | | | |
| Three Months Ended | | Year Ended | 2022 YTD |
| 12/31/2022 | 12/31/2021 | % change | | 12/31/2022 | 12/31/2021 | % change | % of Sales |
| Aerospace Segment | | | | | | | | |
Commercial Transport | $ | 102,843 | | $ | 58,441 | | 76.0 | % | | $ | 314,564 | | $ | 201,990 | | 55.7 | % | 58.8 | % |
Military | 13,198 | | 15,464 | | (14.7) | % | | 54,534 | | 70,312 | | (22.4) | % | 10.2 | % |
| General Aviation | 14,647 | | 15,542 | | (5.8) | % | | 63,395 | | 56,673 | | 11.9 | % | 11.9 | % |
Other | 7,647 | | 9,389 | | (18.6) | % | | 28,703 | | 36,263 | | (20.8) | % | 5.4 | % |
| Aerospace Total | 138,335 | | 98,836 | | 40.0 | % | | 461,196 | | 365,238 | | 26.3 | % | 86.2 | % |
| | | | | | | | |
| Test Systems Segment | 19,818 | | 17,216 | | 15.1 | % | | 73,698 | | 79,670 | | (7.5) | % | 13.8 | % |
| | | | | | | | |
| | | | | | | | |
| | | | | | | | |
| Total Sales | $ | 158,153 | | $ | 116,052 | | 36.3 | % | | $ | 534,894 | | $ | 444,908 | | 20.2 | % | |
| | | | | | | | | | | | | | | | | | | | | | | | | | |
|
| SALES BY PRODUCT LINE |
| (Unaudited, $ in thousands) |
| | | | |
| Three Months Ended | | Year Ended | 2022 YTD |
| 12/31/2022 | 12/31/2021 | % change | | 12/31/2022 | 12/31/2021 | % change | % of Sales |
| Aerospace Segment | | | | | | | | |
Electrical Power & Motion | $ | 54,689 | | $ | 39,003 | | 40.2 | % | | $ | 187,446 | | $ | 141,746 | | 32.2 | % | 35.0 | % |
Lighting & Safety | 34,008 | | 26,820 | | 26.8 | % | | 124,347 | | 103,749 | | 19.9 | % | 23.2 | % |
Avionics | 29,781 | | 17,546 | | 69.7 | % | | 97,234 | | 64,901 | | 49.8 | % | 18.2 | % |
Systems Certification | 10,566 | | 5,113 | | 106.6 | % | | 17,222 | | 13,050 | | 32.0 | % | 3.2 | % |
Structures | 1,644 | | 965 | | 70.4 | % | | 6,244 | | 5,529 | | 12.9 | % | 1.2 | % |
Other | 7,647 | | 9,389 | | (18.6) | % | | 28,703 | | 36,263 | | (20.8) | % | 5.4 | % |
| Aerospace Total | 138,335 | | 98,836 | | 40.0 | % | | 461,196 | | 365,238 | | 26.3 | % | 86.2 | % |
| | | | | | | | |
| Test Systems Segment | 19,818 | | 17,216 | | 15.1 | % | | 73,698 | | 79,670 | | (7.5) | % | 13.8 | % |
| | | | | | | | |
| | | | | | | | |
| | | | | | | | |
| Total Sales | $ | 158,153 | | $ | 116,052 | | 36.3 | % | | $ | 534,894 | | $ | 444,908 | | 20.2 | % | |
Astronics Corporation Reports 2022 Fourth Quarter and Full Year Financial Results
March 2, 2023
Page 12
| | | | | | | | | | | | | | | | | |
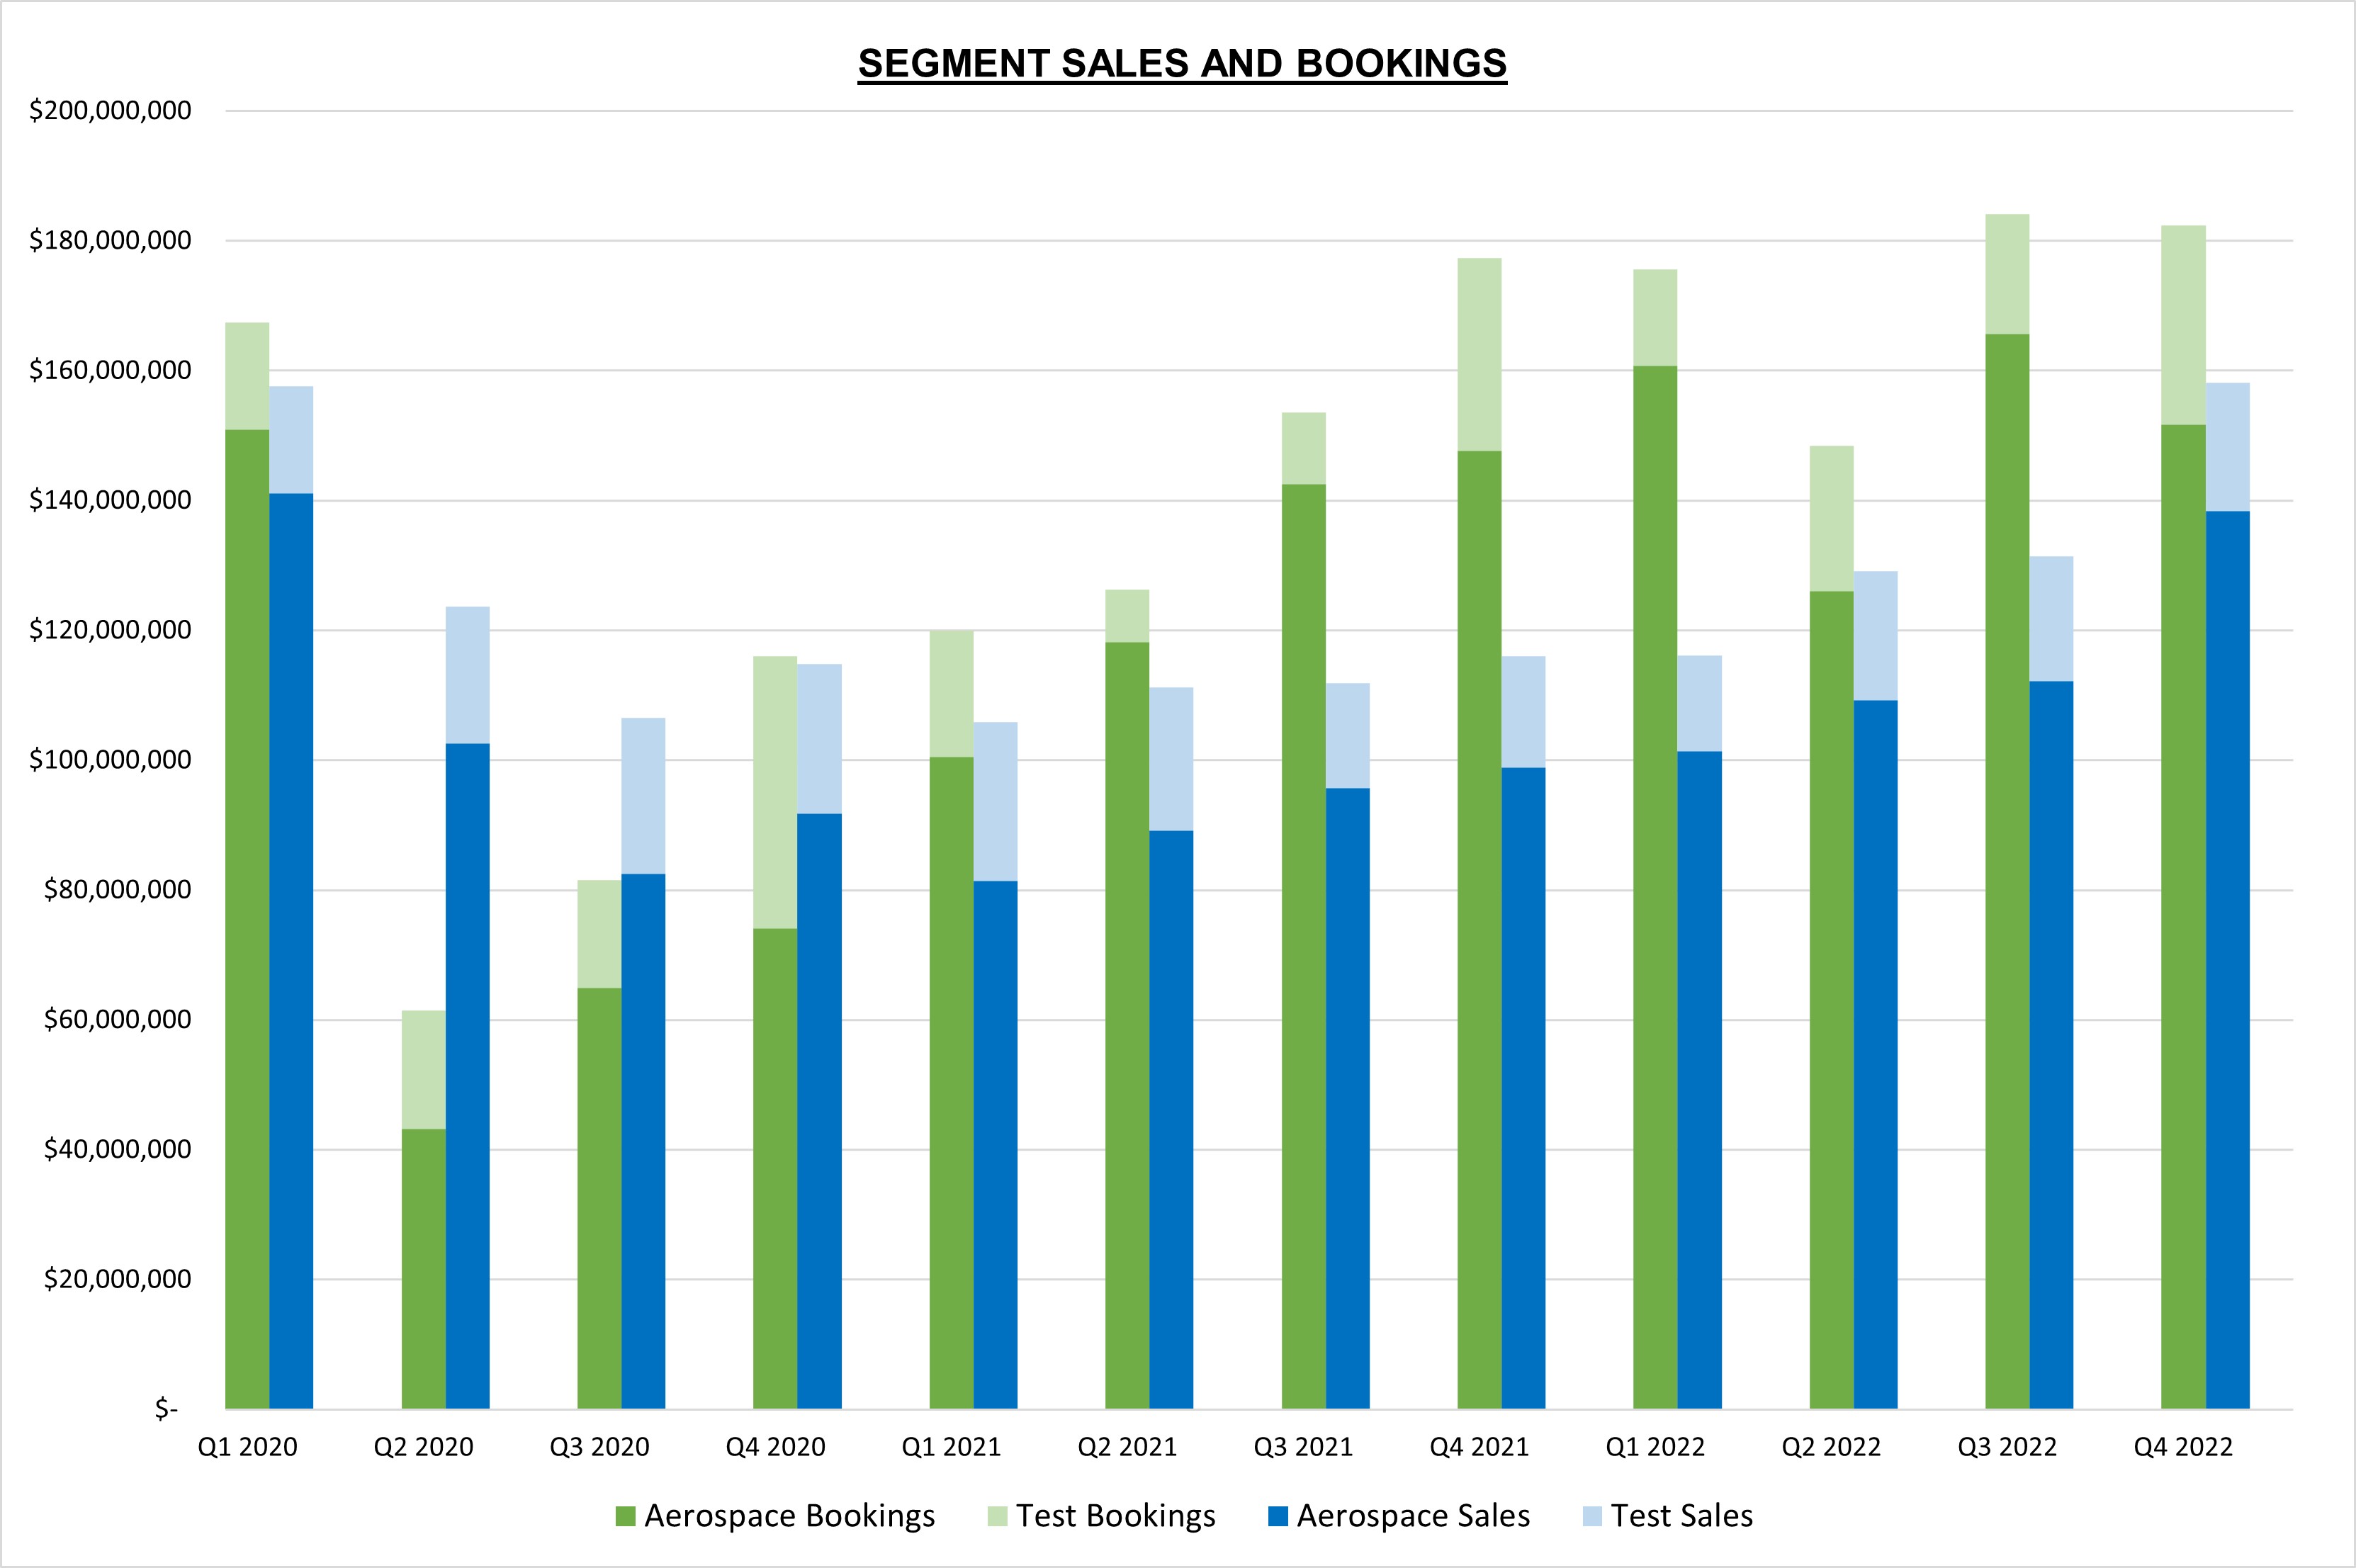
ASTRONICS CORPORATION |
ORDER AND BACKLOG TREND |
(Unaudited, $ in thousands) |
| Q1 2022 | Q2 2022 | Q3 2022 | Q4 2022 | Trailing Twelve Months |
| 4/2/2022 | 7/2/2022 | 10/1/2022 | 12/31/2022 | 12/31/2022 |
| Sales | | | | | |
| Aerospace | $ | 101,394 | | $ | 109,290 | | $ | 112,177 | | $ | 138,335 | | $ | 461,196 | |
| Test Systems | 14,782 | | 19,837 | | 19,261 | | 19,818 | | 73,698 | |
| Total Sales | $ | 116,176 | | $ | 129,127 | | $ | 131,438 | | $ | 158,153 | | $ | 534,894 | |
| | | | | |
| Bookings | | | | | |
| Aerospace | $ | 160,778 | | $ | 126,012 | | $ | 165,719 | | $ | 151,688 | | $ | 604,197 | |
| Test Systems | 14,844 | | 22,377 | | 18,433 | | 30,707 | | 86,361 | |
| Total Bookings | $ | 175,622 | | $ | 148,389 | | $ | 184,152 | | $ | 182,395 | | $ | 690,558 | |
| | | | | |
Backlog | | | | | |
| Aerospace | $ | 394,043 | | $ | 410,765 | | $ | 464,307 | | $ | 477,660 | | |
| Test Systems | 81,095 | | 83,635 | | 82,807 | | 93,696 | | |
| Total Backlog | $ | 475,138 | | $ | 494,400 | | $ | 547,114 | | $ | 571,356 | | N/A |
| | | | | |
| Book:Bill Ratio | | | | | |
| Aerospace | 1.59 | 1.15 | 1.48 | 1.10 | 1.31 |
| Test Systems | 1.00 | 1.13 | 0.96 | 1.55 | 1.17 |
| Total Book:Bill | 1.51 | 1.15 | 1.40 | 1.15 | 1.29 |
| | | | | |